|
Miért büntették meg a matrózt, aki hagyta megállni a hajókronométert?
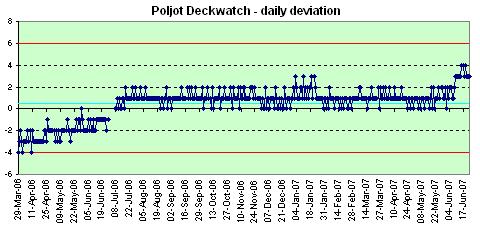
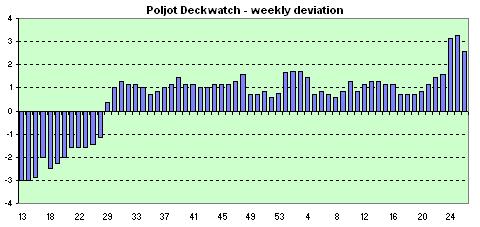
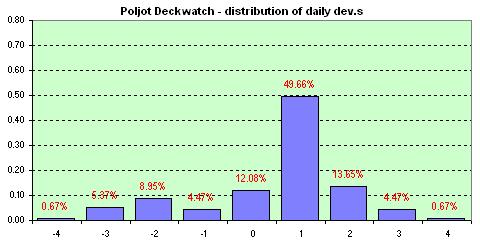
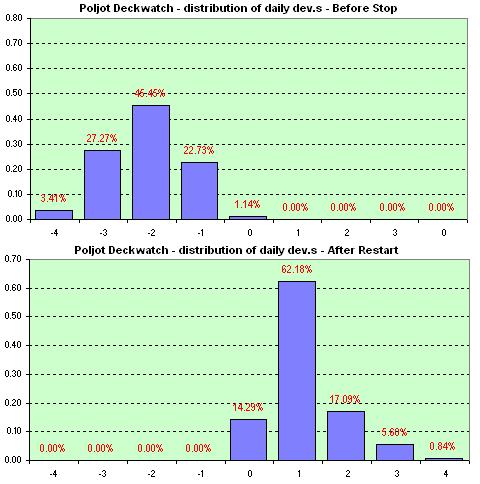
A GPS korszak elött a tengerészeti navigációban a hosszúsági koordináta meghatározására pontos órát használtak. Az óra 1 mp-es eltérése az egyelítön kb. 450 m eltérést jelent. Napi egy másodperc eltérés egy mechanikus óránál kíváló eredmény. Sok napos útón ez egyenletes sités vagy késés mellett az eltrés tetemes lehet, de, ha tudjuk , hogy az óra mennyit siet, vagy késik naponta, ezt számítással korrigálhatjuk. Ebböl világos, hogy az óra stabil járása legalább olyan fontos, mint az, hogy kicsi legyen a napi járáseltérés. Van azonban egy jelenség, ami veszélyes lehet. Ha egy mechanikus óra megáll, újra indítás után a "karaktere" (siet vagy késik), gyakran megváltozik. Nyári szabadságom alatt megesett ez az igen pontos Poljot Deckwatch-al is. Ez lehetöséget ad arra, hogy kísérletileg is bemutassam a jelenséget. A napi mérési eredményekés a heti számított átlagos eltérések után látható a kétcsúcsos aggregált eloszlás görbe, ami a valóságosnál rosszabb képet ad az óráról. Alatta azonban bemutatom azonos koordináta rendszerben a megállás elötti és az újraindítás utáni méréssorozat eloszlását is, valamint a szórás értékek idöbeli változását is. Az óra kíváló teljesítményt nyújt a megllás elött és után is, csupán az átlagérték változott meg, ami az egyesített értéket rontja. |
Why was the seaman punished if he let stop the ship chronometer?
Before the GPS age in naval navigation very preise watches were used to calculate the longitude co-rordinate. One second deviation on the equator would mean around 1/4 mile. Daily one second deviation is a great result for a mechanical watch, but during a long trip it may add up to a high value. If we know how much is the mean daily rate we can correct the time / co-ordinate value. That shows the stability of the watch is equally important than the minimal daily deviation. There is a phenomena what can be dangerous. If a mechanical watch stops, having rewound its 'character' (being quick or slow) often changes. During my summer holidays that hapened to the very precise Poljot Deckwatch. That allows me to demonstrate on a statistical way the phenomena. After the daily results and the calculated weekly average deviations can be seen the 'two-peeks' aggregated distribution, what shows a worse than real picture on the watch. Below I show in the same coordinate system the distributions of the daily deviations before and after stopping the watch as well as the time function of the deviation values. The watch perfoms very well before and after stopping as well, it is only the mean value of deviation what changed. That destroys the aggregated distribution. |
|
|
Start |
End |
Days |
Std.Dev. |
Avg. |
Megállás elött |
Before stop |
2006-Mar-28 |
2006-Jun-25 |
88 |
0.825 |
-2.09 |
Újraindítás után |
After restart |
2006-Jul-07 |
2007-Jun-30 |
357 |
0.767 |
1.17 |
Teljes |
Total |
2006-Mar-28 |
2007-Jun-30 |
445 |
1.510 |
0.52 |
|
|
Kezdet |
Befejezés |
Nap |
Szórás |
Átlag |